> ## Documentation Index
> Fetch the complete documentation index at: https://hastekit.ai/docs/llms.txt
> Use this file to discover all available pages before exploring further.
# Traces
> OpenTelemetry traces for every agent run — drill into spans for LLM calls, tool calls, and sub-agents
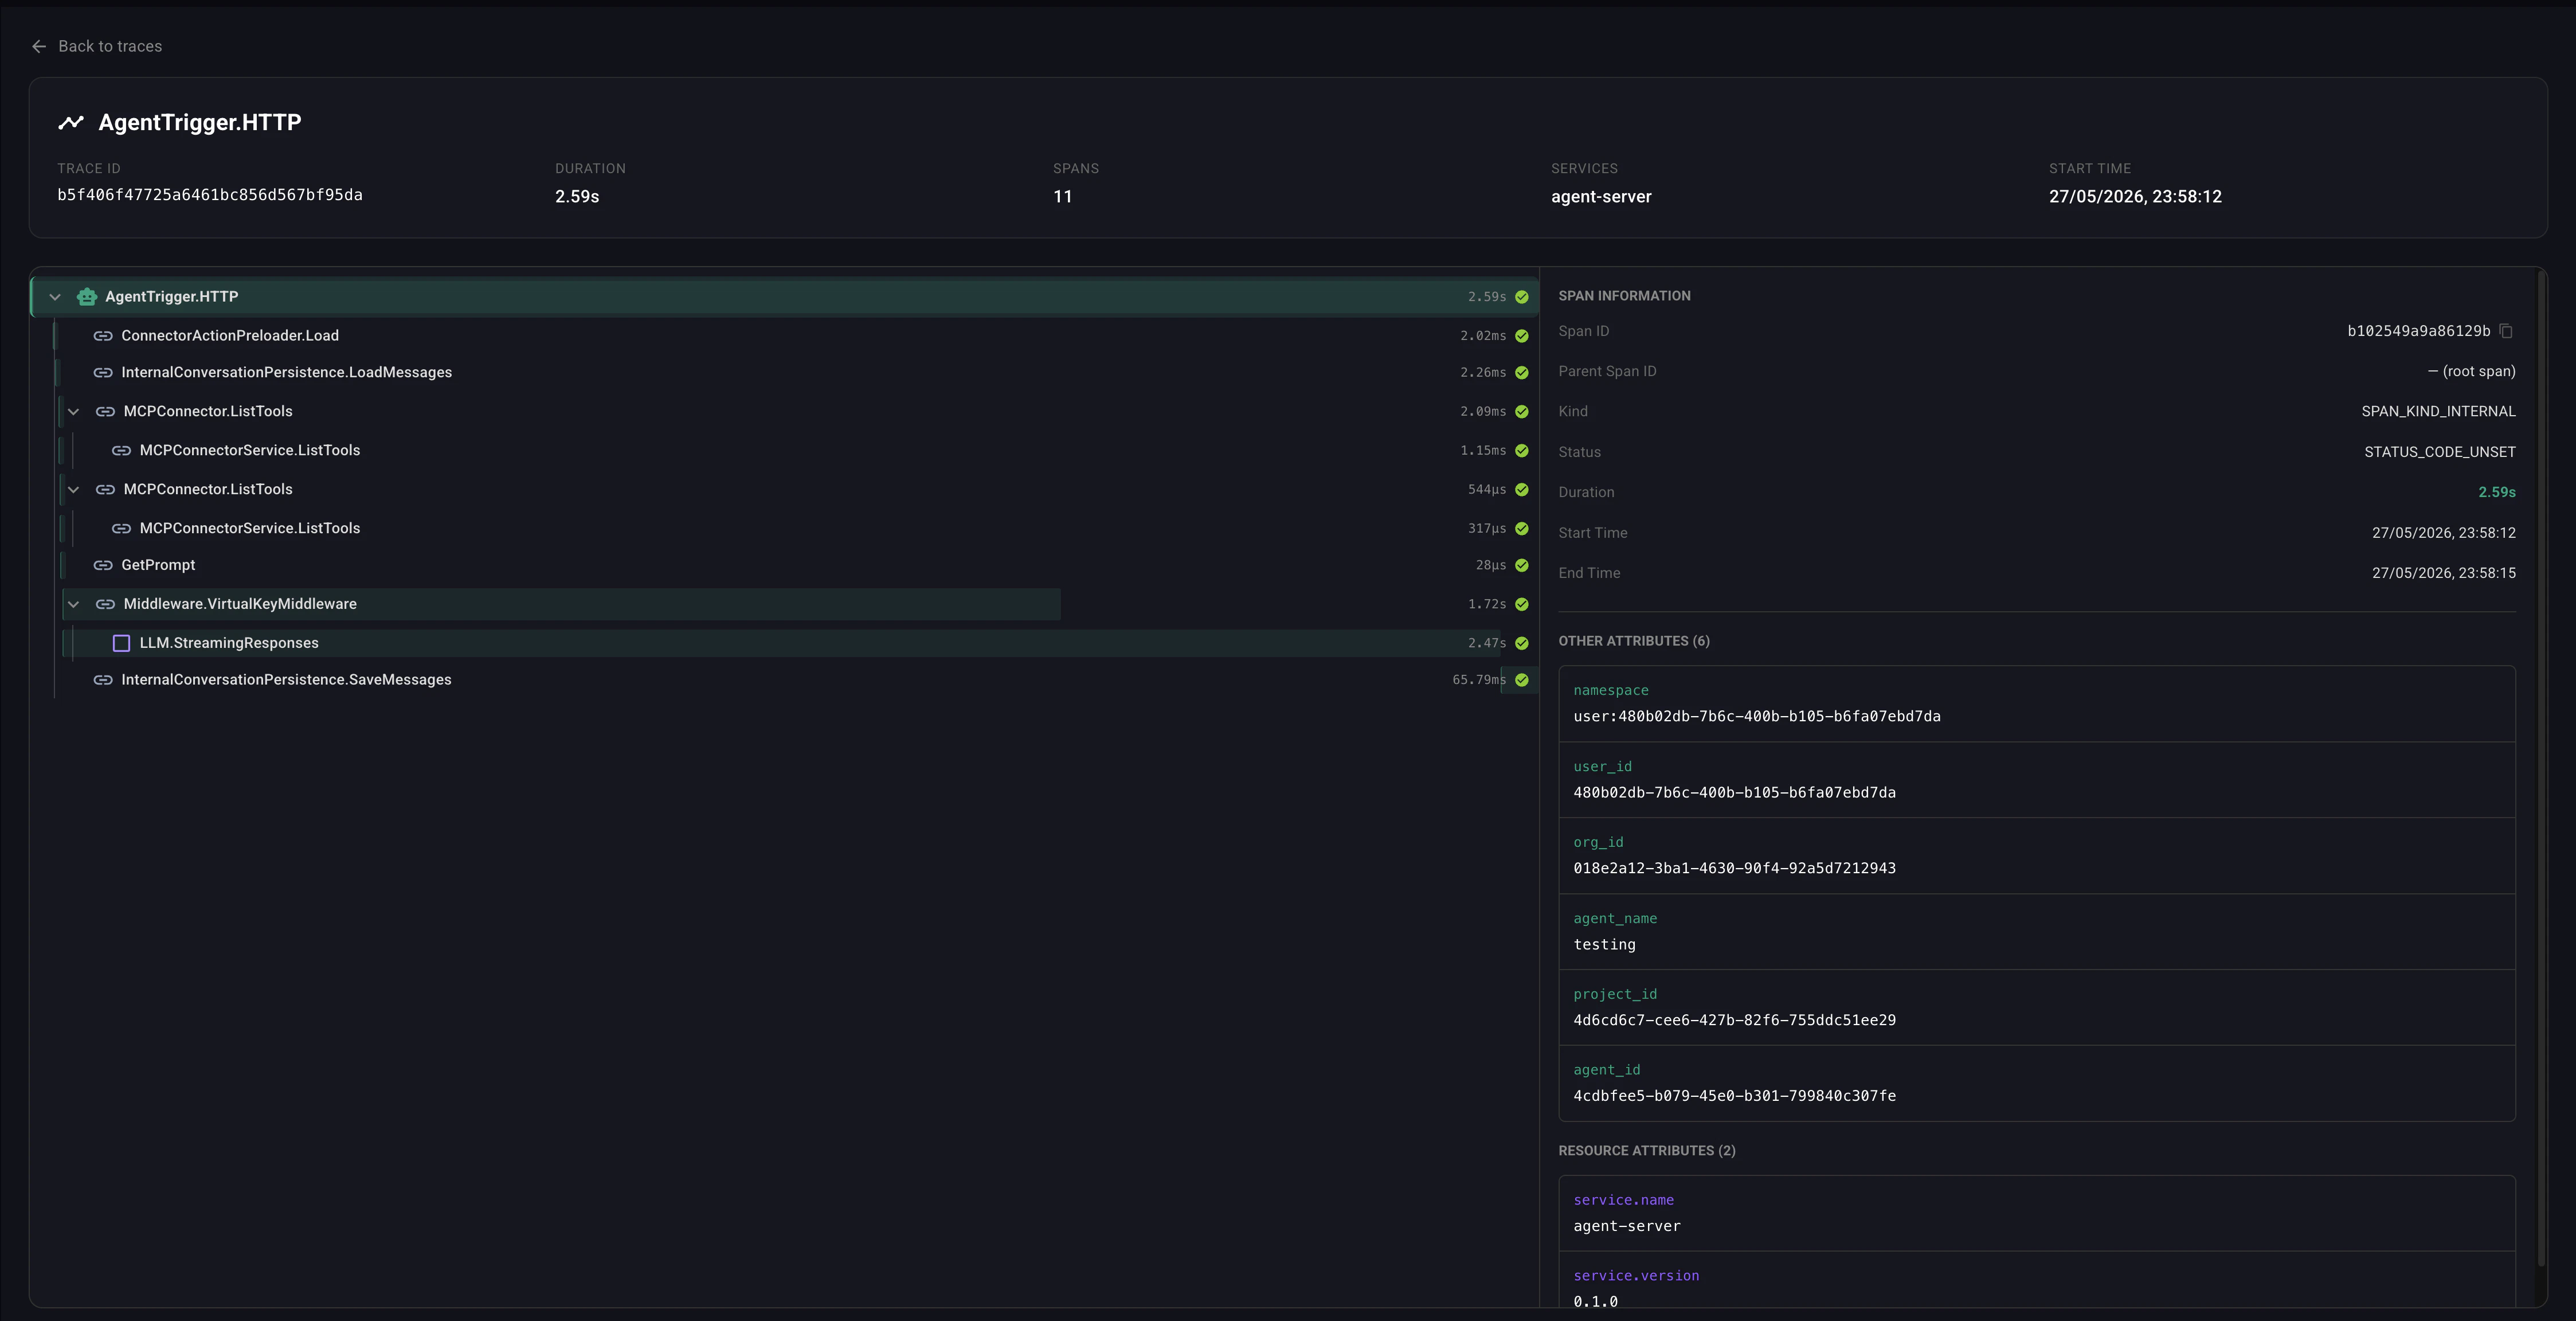
Every agent invocation produces a hierarchical OpenTelemetry trace. Each LLM call, tool call, sub-agent invocation, memory retrieval, and persistence operation is a span — with duration, status, attributes, and parent/child links you can drill into.
 ## What's traced
A typical agent run produces spans like:
```
AgentTrigger.HTTP
├── InternalConversationPersistence.LoadMessages
├── GetPrompt
├── Middleware.VirtualKeyMiddleware
├── LLM.StreamingResponses (Claude Sonnet 4.6)
├── Tool.MCP.search_repo
├── Tool.GoogleCalendar.ListEvents
├── LLM.StreamingResponses (Claude Sonnet 4.6)
└── InternalConversationPersistence.SaveMessages
```
Each span captures:
| Field | Notes |
| ---------------------- | -------------------------------------------------------------------------------------------------------------------------------------------------------------------------------------------- |
| **ID** & **Parent ID** | The tree structure. |
| **Kind** | `LLM`, `Tool`, `Agent`, `Workflow`, `Internal`, etc. |
| **Duration** | Start and end timestamps. |
| **Status** | OK / Error, with error message on failure. |
| **Attributes** | `agent_name`, `agent_id`, `agent_version`, `project_id`, `user_id`, `org_id`, plus span-kind specific fields (model name and token counts for LLM spans; tool name and args for Tool spans). |
## Browsing traces
1. Open **Agent Framework → Traces**.
2. Use the filters at the top:
* **Time range** — last hour, 6h, 24h, 7d, 30d, or custom.
* **Service** — filter to a specific agent or workflow.
* **Trace ID** — jump straight to a single run.
3. The list shows aggregate metrics for the current filter (total spans, error rate, avg duration, active services).
4. Click a trace to open the span tree. Each span can be expanded for its attributes, resource attributes, and any associated errors.
## Jumping in from a chat
In the [Chat UI](/docs/gateway/agent-builder/conversing-with-the-agent), each assistant message has a **View trace** link in its footer. Click it to jump to the exact trace for that run — no filter juggling needed.
## What you can answer with traces
* **Why was that response slow?** — see which span took the time (LLM vs tool).
* **Why did the agent loop?** — count LLM-call spans, see which tool calls failed.
* **What did the model see?** — inspect the prompt that went to the LLM, including retrieved knowledge chunks and summarized history.
* **What did this tool actually return?** — click the tool span for the raw result.
* **Which version executed?** — `agent_version` attribute disambiguates aliased runs.
## Workflows
[Workflow](/docs/gateway/agent-builder/workflows) runs produce traces with the same structure — each node is a span, and AI Agent nodes contribute their full agent trace as a sub-tree. So a workflow that runs a sub-agent gives you one trace covering both layers.
## Gateway-side traces
If you're calling models directly through the LLM Gateway (without the agent framework), see [LLM Gateway Tracing](/docs/gateway/llm/tracing) — same OpenTelemetry foundation, gateway-scoped view.
## What's traced
A typical agent run produces spans like:
```
AgentTrigger.HTTP
├── InternalConversationPersistence.LoadMessages
├── GetPrompt
├── Middleware.VirtualKeyMiddleware
├── LLM.StreamingResponses (Claude Sonnet 4.6)
├── Tool.MCP.search_repo
├── Tool.GoogleCalendar.ListEvents
├── LLM.StreamingResponses (Claude Sonnet 4.6)
└── InternalConversationPersistence.SaveMessages
```
Each span captures:
| Field | Notes |
| ---------------------- | -------------------------------------------------------------------------------------------------------------------------------------------------------------------------------------------- |
| **ID** & **Parent ID** | The tree structure. |
| **Kind** | `LLM`, `Tool`, `Agent`, `Workflow`, `Internal`, etc. |
| **Duration** | Start and end timestamps. |
| **Status** | OK / Error, with error message on failure. |
| **Attributes** | `agent_name`, `agent_id`, `agent_version`, `project_id`, `user_id`, `org_id`, plus span-kind specific fields (model name and token counts for LLM spans; tool name and args for Tool spans). |
## Browsing traces
1. Open **Agent Framework → Traces**.
2. Use the filters at the top:
* **Time range** — last hour, 6h, 24h, 7d, 30d, or custom.
* **Service** — filter to a specific agent or workflow.
* **Trace ID** — jump straight to a single run.
3. The list shows aggregate metrics for the current filter (total spans, error rate, avg duration, active services).
4. Click a trace to open the span tree. Each span can be expanded for its attributes, resource attributes, and any associated errors.
## Jumping in from a chat
In the [Chat UI](/docs/gateway/agent-builder/conversing-with-the-agent), each assistant message has a **View trace** link in its footer. Click it to jump to the exact trace for that run — no filter juggling needed.
## What you can answer with traces
* **Why was that response slow?** — see which span took the time (LLM vs tool).
* **Why did the agent loop?** — count LLM-call spans, see which tool calls failed.
* **What did the model see?** — inspect the prompt that went to the LLM, including retrieved knowledge chunks and summarized history.
* **What did this tool actually return?** — click the tool span for the raw result.
* **Which version executed?** — `agent_version` attribute disambiguates aliased runs.
## Workflows
[Workflow](/docs/gateway/agent-builder/workflows) runs produce traces with the same structure — each node is a span, and AI Agent nodes contribute their full agent trace as a sub-tree. So a workflow that runs a sub-agent gives you one trace covering both layers.
## Gateway-side traces
If you're calling models directly through the LLM Gateway (without the agent framework), see [LLM Gateway Tracing](/docs/gateway/llm/tracing) — same OpenTelemetry foundation, gateway-scoped view.