
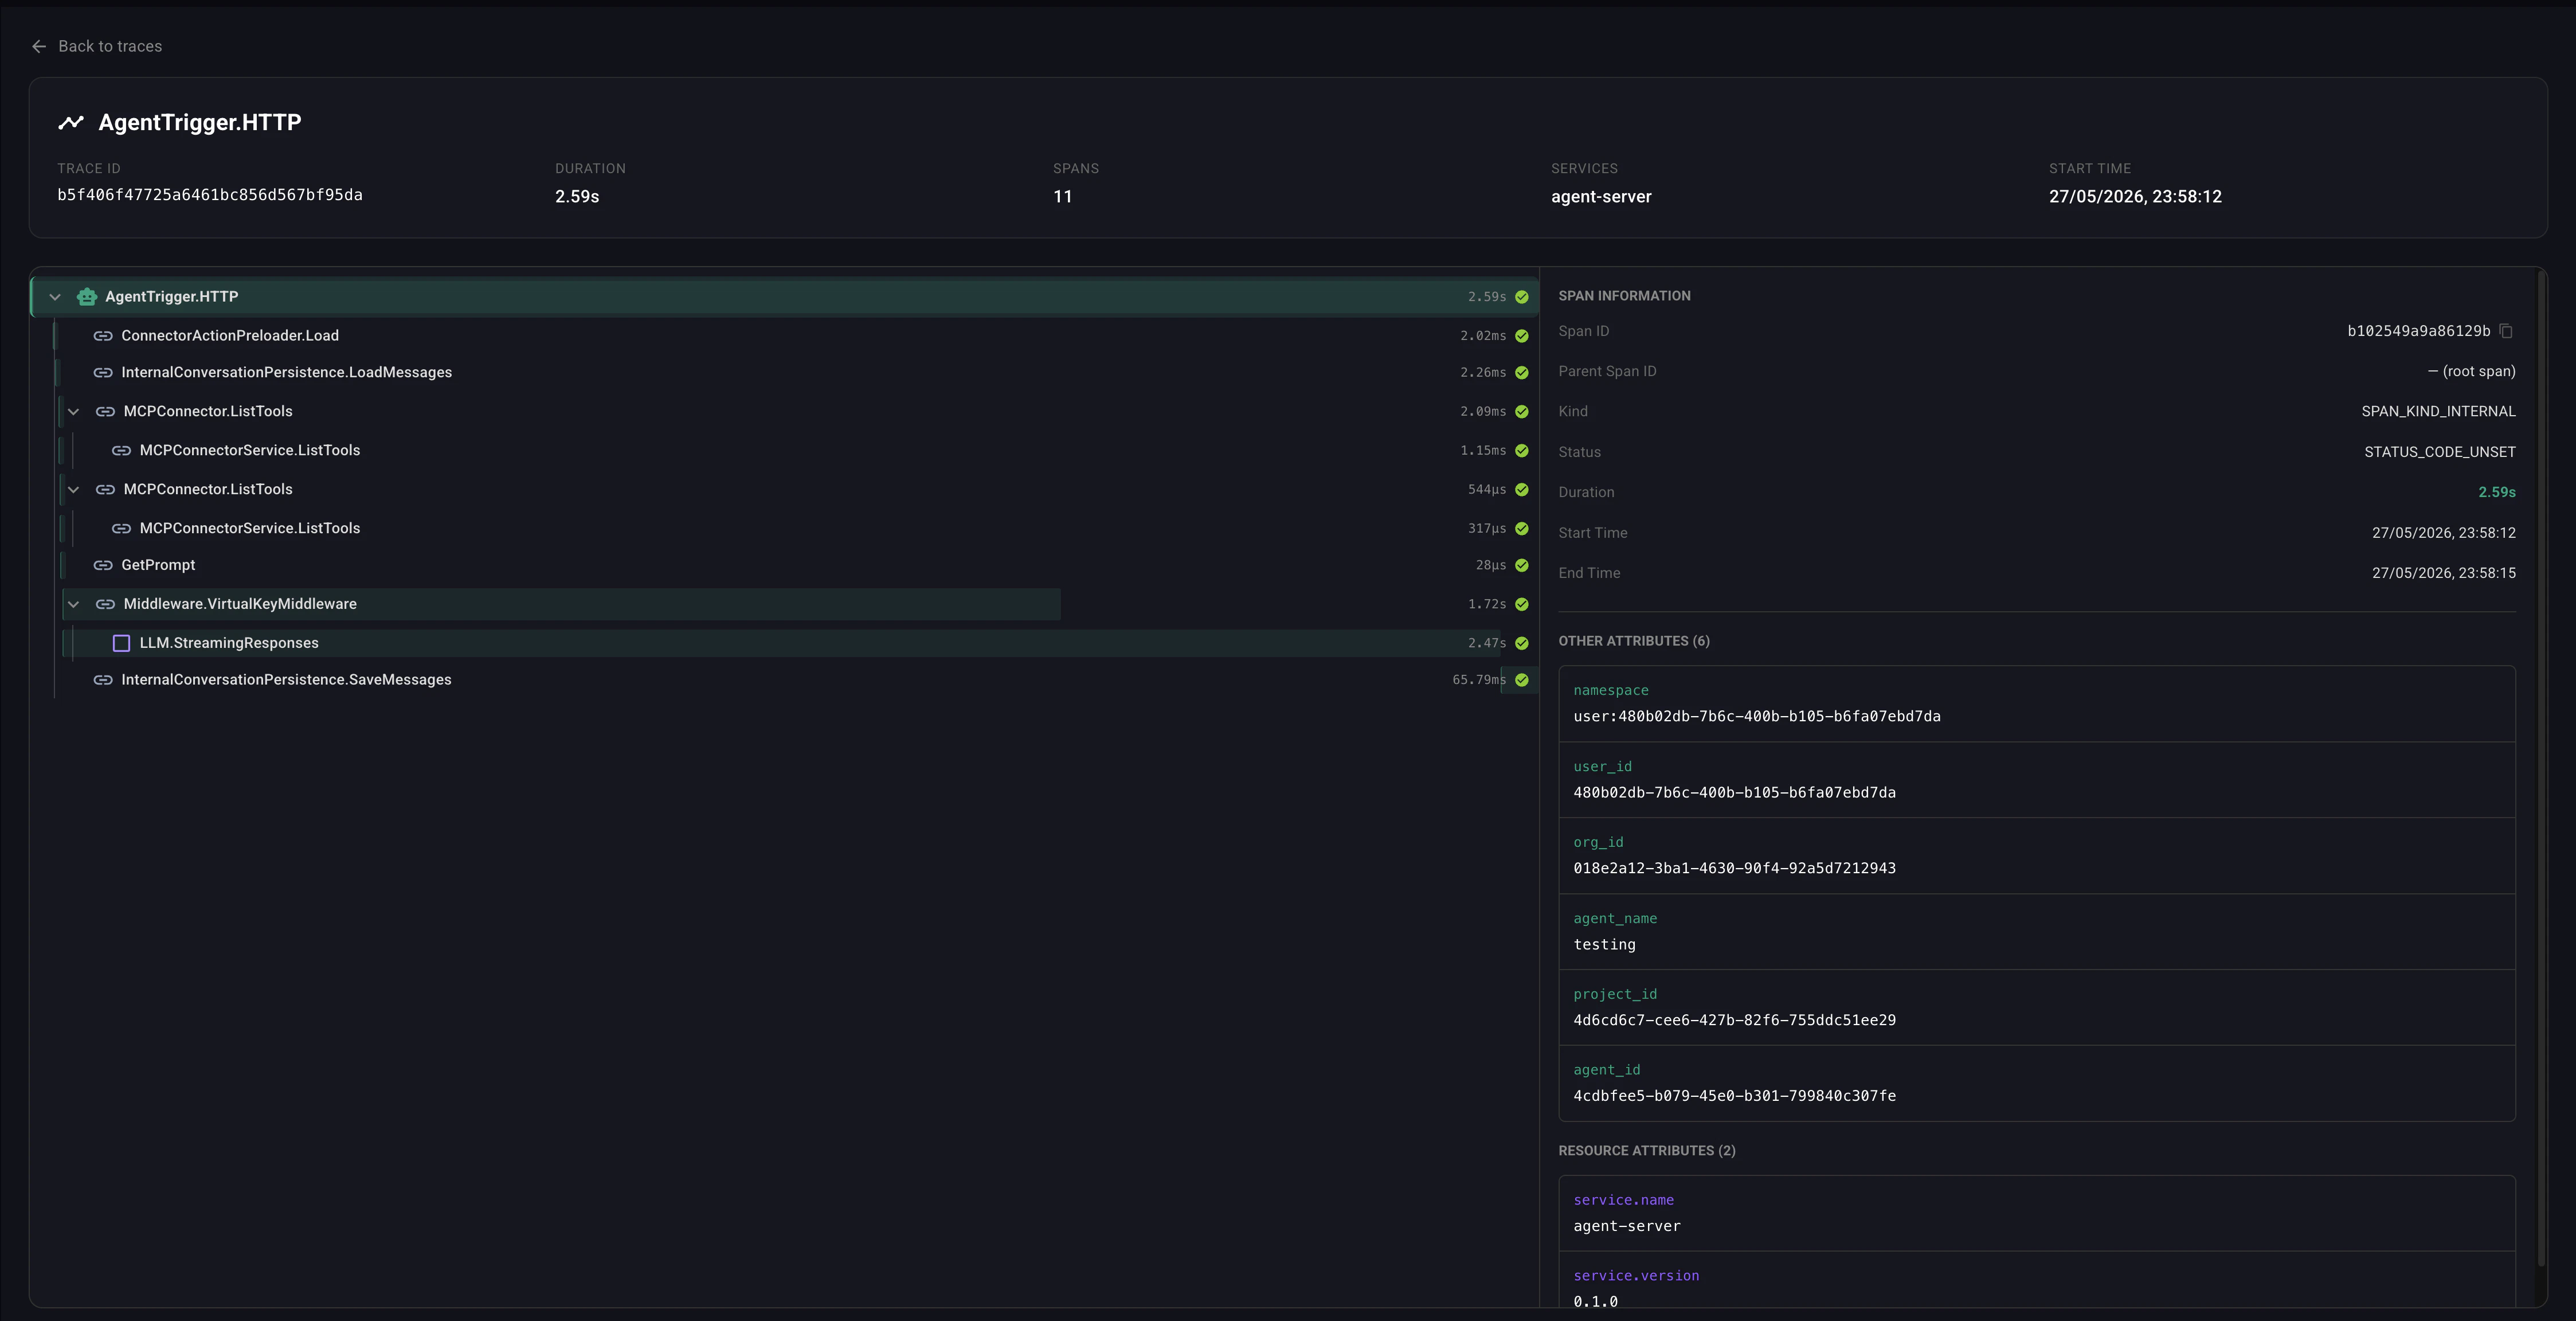
What’s traced
A typical agent run produces spans like:Browsing traces
- Open Agent Framework → Traces.
- Use the filters at the top:
- Time range — last hour, 6h, 24h, 7d, 30d, or custom.
- Service — filter to a specific agent or workflow.
- Trace ID — jump straight to a single run.
- The list shows aggregate metrics for the current filter (total spans, error rate, avg duration, active services).
- Click a trace to open the span tree. Each span can be expanded for its attributes, resource attributes, and any associated errors.
Jumping in from a chat
In the Chat UI, each assistant message has a View trace link in its footer. Click it to jump to the exact trace for that run — no filter juggling needed.What you can answer with traces
- Why was that response slow? — see which span took the time (LLM vs tool).
- Why did the agent loop? — count LLM-call spans, see which tool calls failed.
- What did the model see? — inspect the prompt that went to the LLM, including retrieved knowledge chunks and summarized history.
- What did this tool actually return? — click the tool span for the raw result.
- Which version executed? —
agent_versionattribute disambiguates aliased runs.